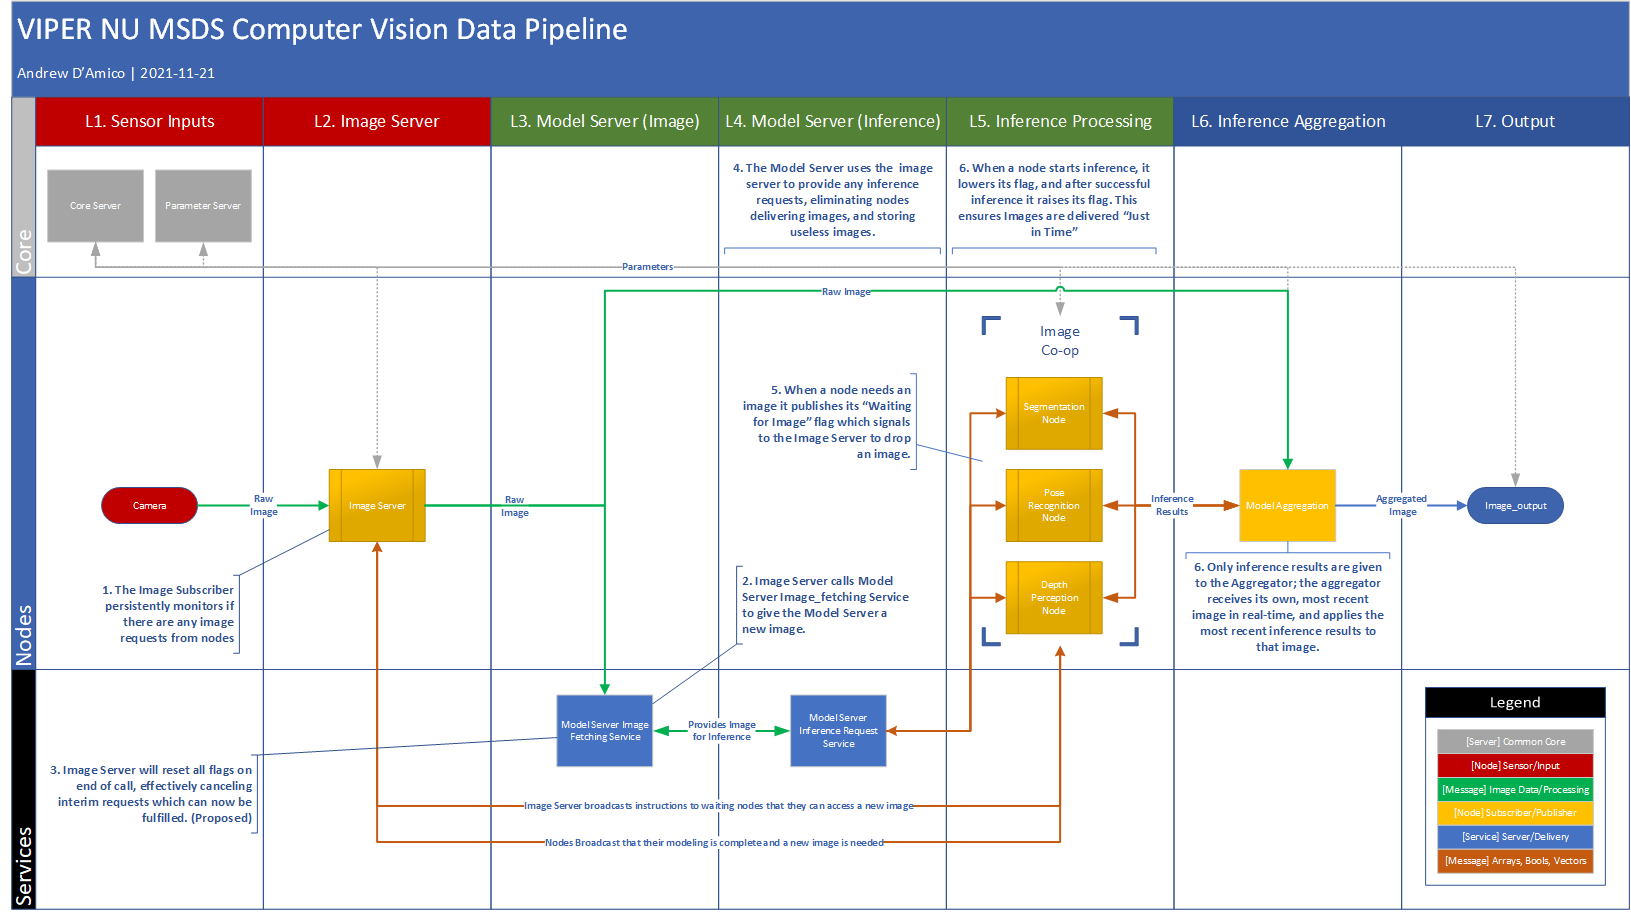
3. Viper Data Process Diagram
The following Process Diagram shows how the different Viper nodes communicate with one another. The green lines indicate processes where an image is being shared between two nodes, whereas an orange line shows where data is being communicated in the form of messages ranging from simple Bool to arrays of matrices.
Fig. 1 Viper Process Diagram

