2. Viper Communication Diagram
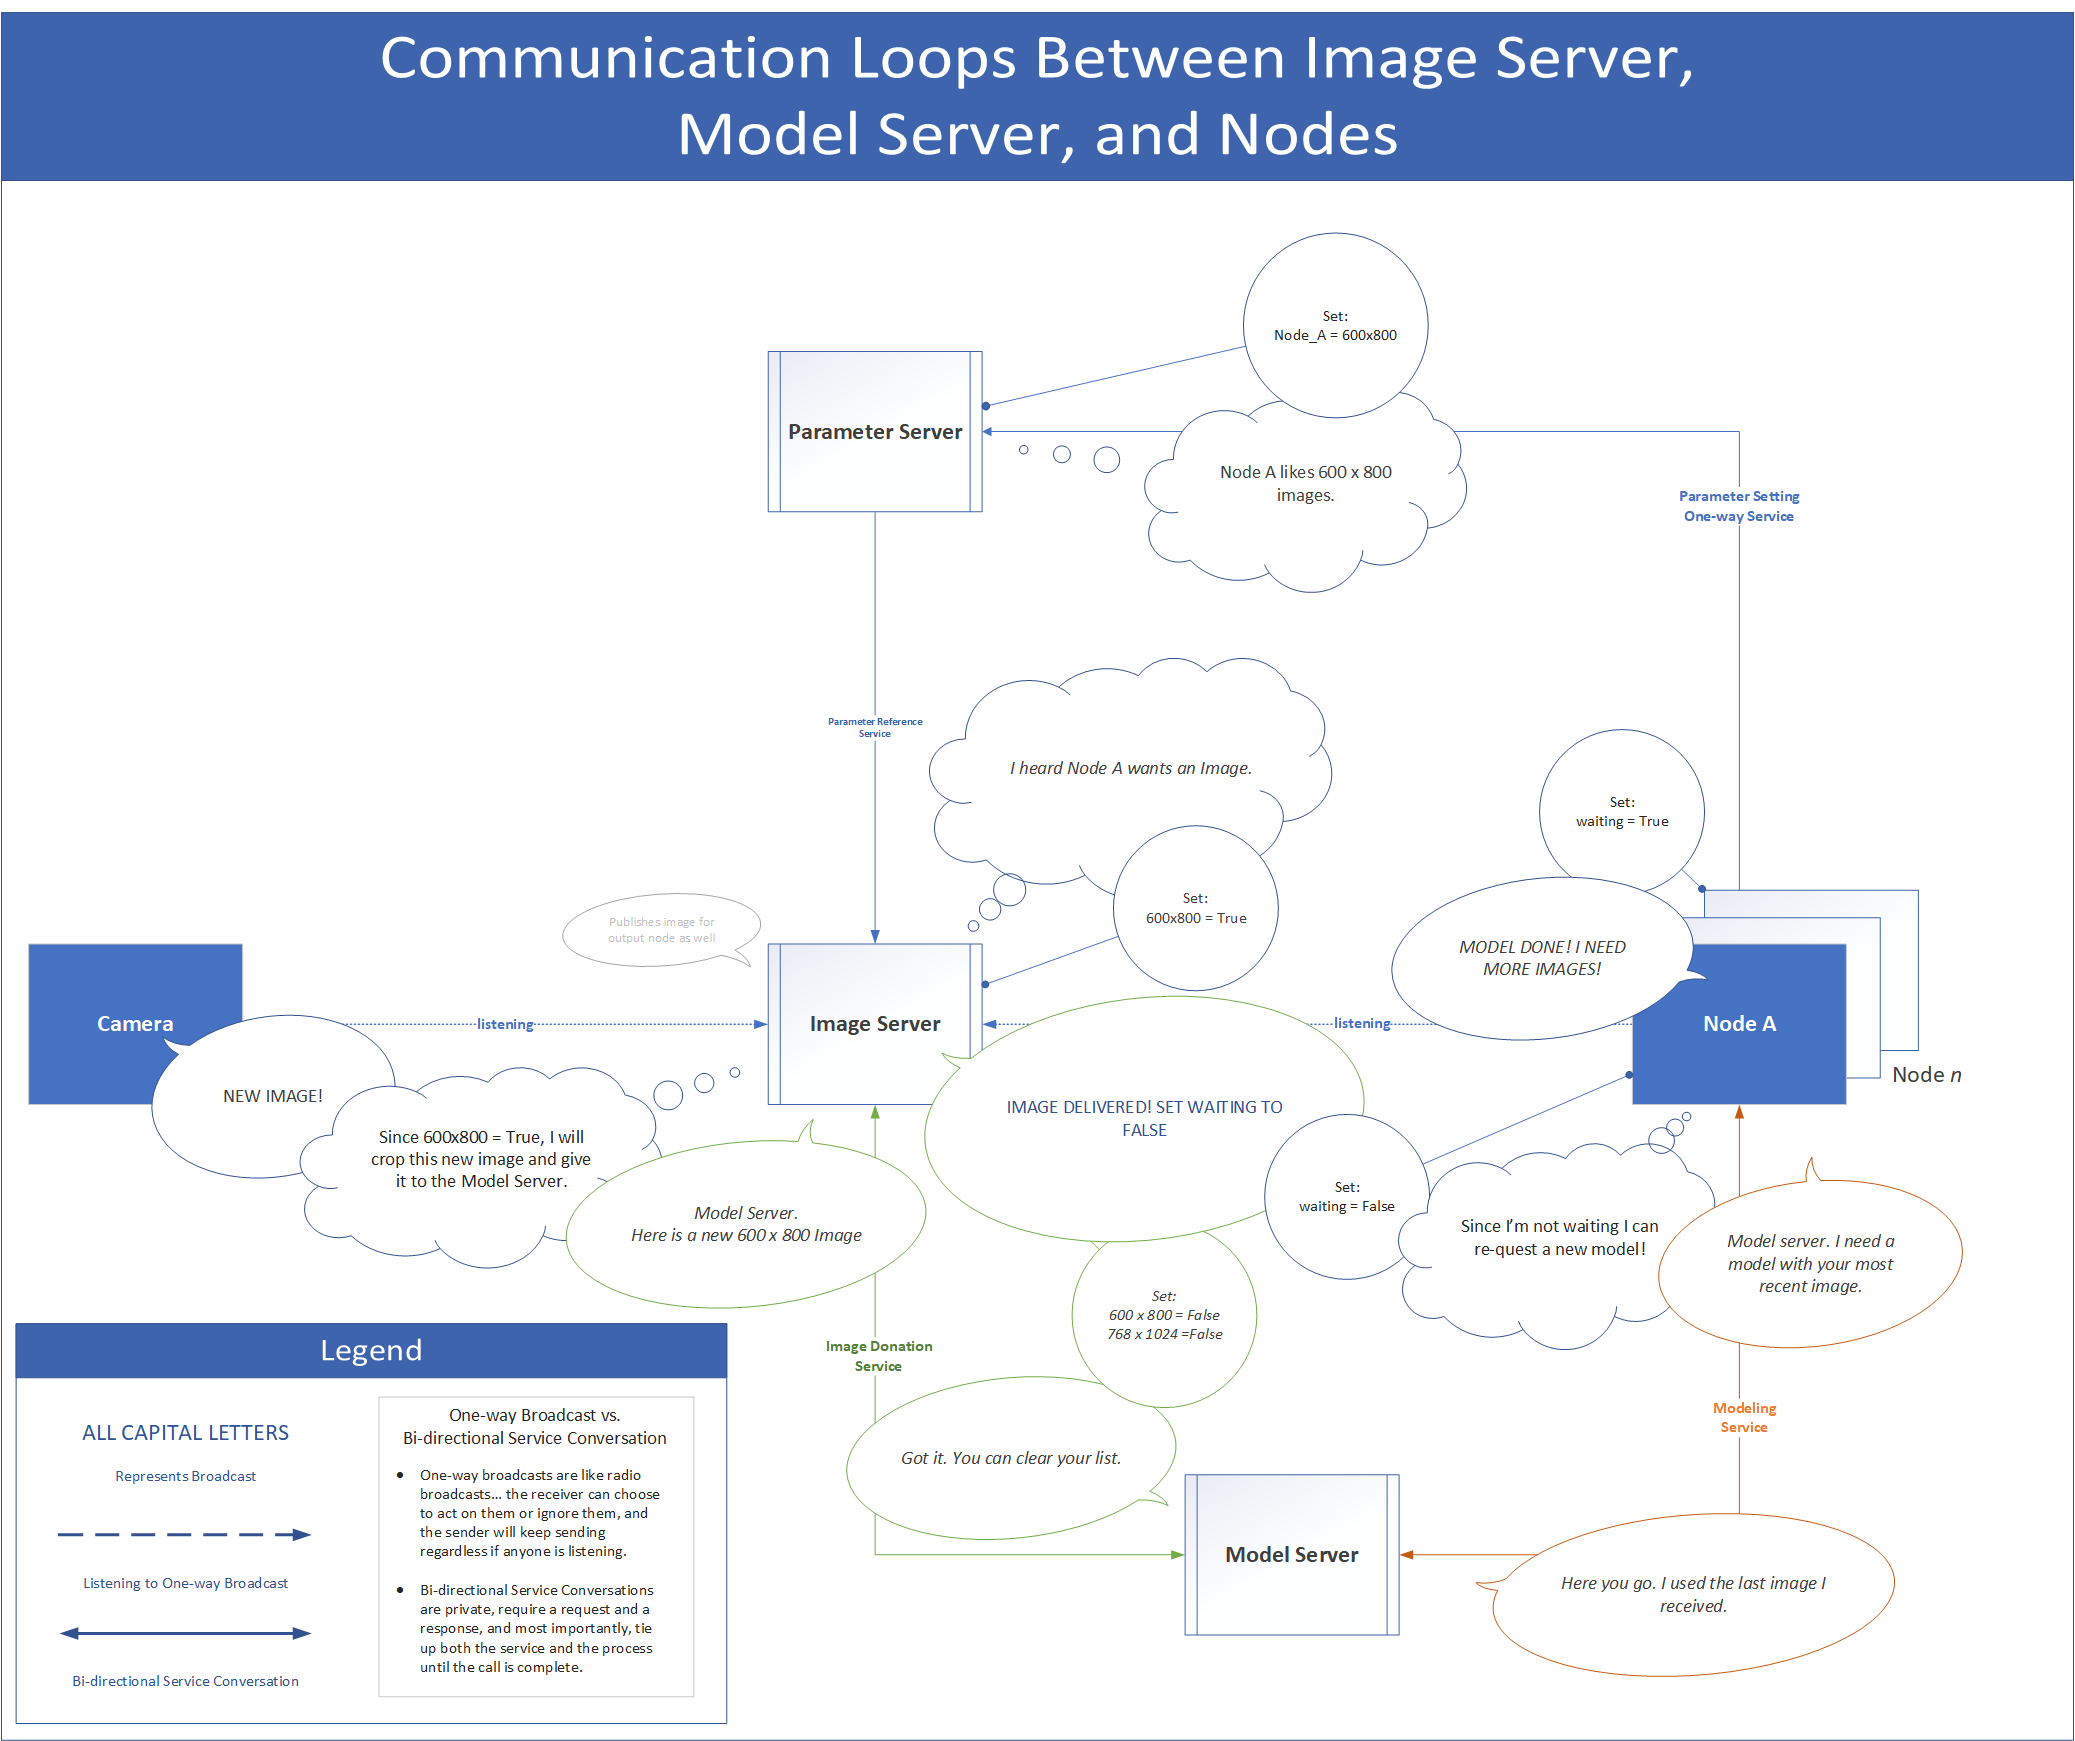
The following Diagram shows the general communication pattern of the network, and is meant to “humanize” the process.
Thought bubbles indicate the logic being executed
Speech bubbles indicate either node-to-node communciation or broadcasts “e.g. SHOUTING!” which is heard by all nodes.
Circles are meant to show how a variable is being updated.
Callouts are stacked in the order by which they happen, with older messages on the bottom. They are also arranged in such a way that their placement relative to surrounding line-edges and callouts is significant.
line-edges represent formal relationships (e.g., processes) and the callouts should be read counter-clockwise
Fig. 1 Viper Process Diagram